Hub Setup
hub-setup.RmdHosting a Forecasting hub with GitHub
A forecasting hub is a centralized data portal that supports weekly forecasting activities. In this workshop, we use the Hubverse ecosystem to build a forecasting hub that lives in GitHub. The hub stores and archives both training data and forecast outputs, and it supports weekly forecast report generation from those files.
Our goal here is to set up a hub for a single person running the forecasting workflow. Because it is built within the Hubverse ecosystem, however, the same hub can be extended into a collaborative, multi-team hub and paired with a dashboard, all with minimal changes to what you build today.
Prerequisites
We will create a forecasting hub during the workshop. Please complete the following steps before the workshop.
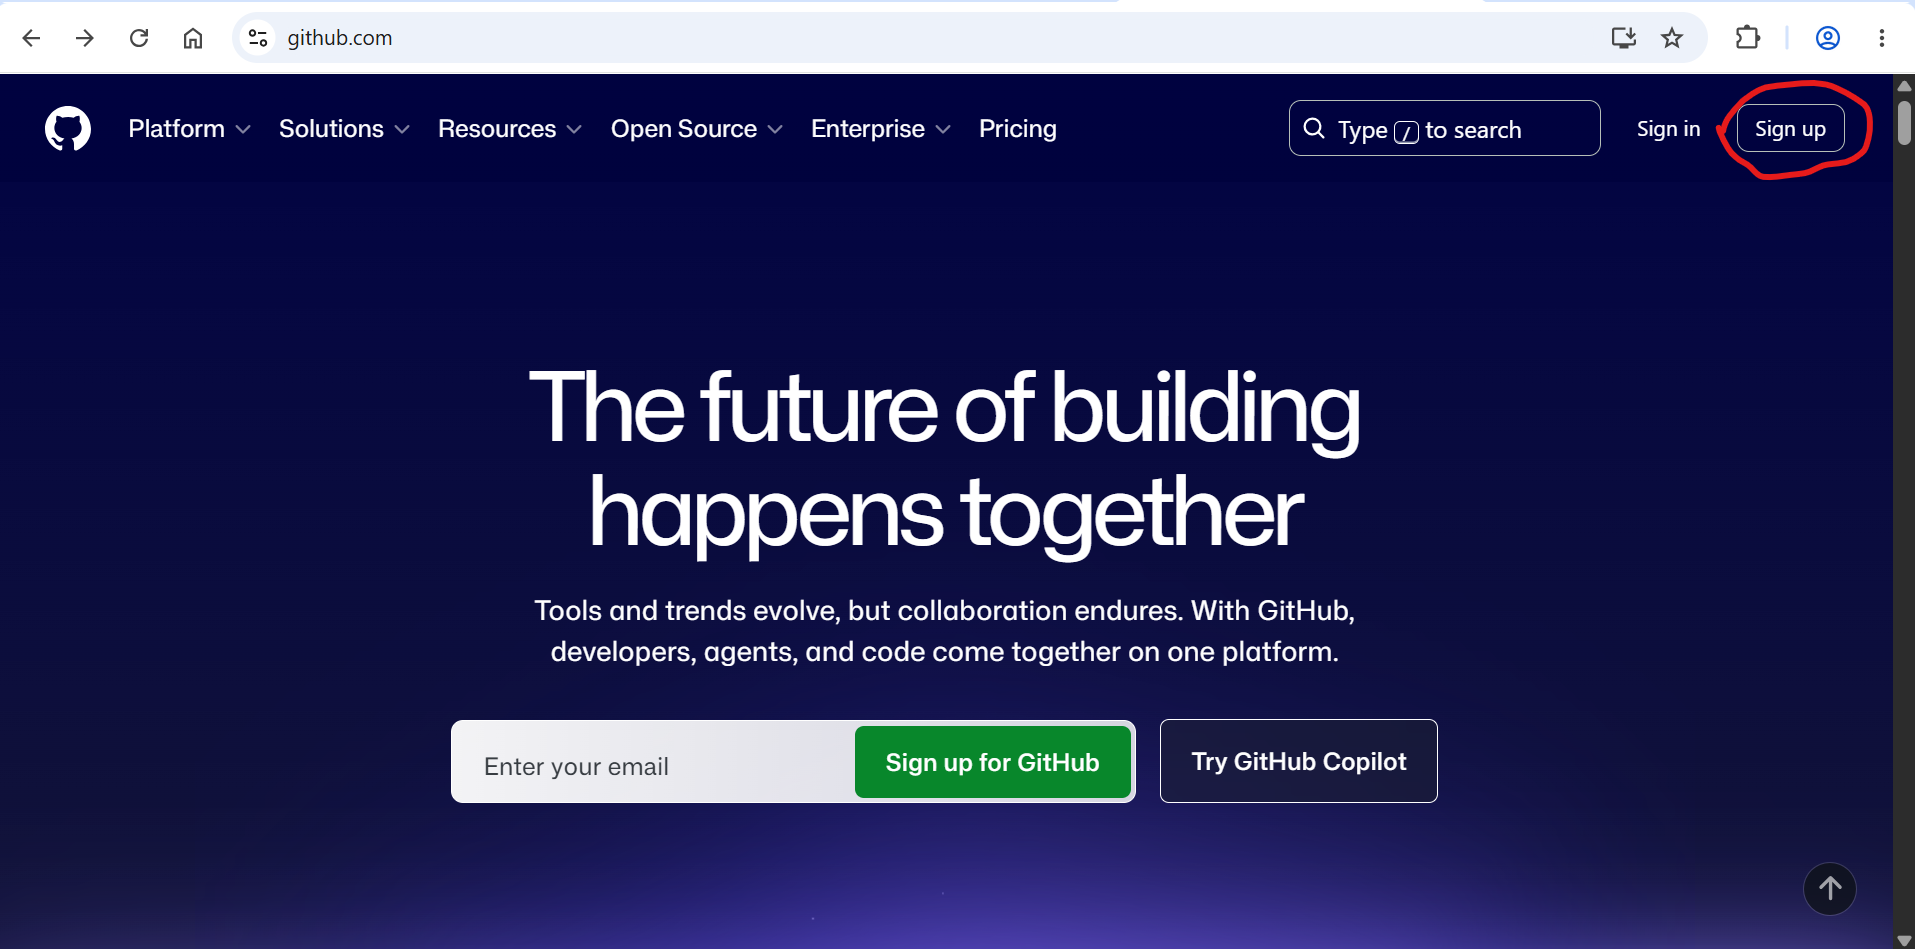
1. Create or open your GitHub account
Follow these instructions to create a GitHub account. A free account is all you need.
2. Install GitHub Desktop
GitHub Desktop is a graphical application for interacting with Git and GitHub. It simplifies version control tasks, making it easier to manage repositories and track changes without using the command line.
First, download GitHub Desktop. Once it is installed on your machine, open the application and sign in with the GitHub account you created in Step 1.
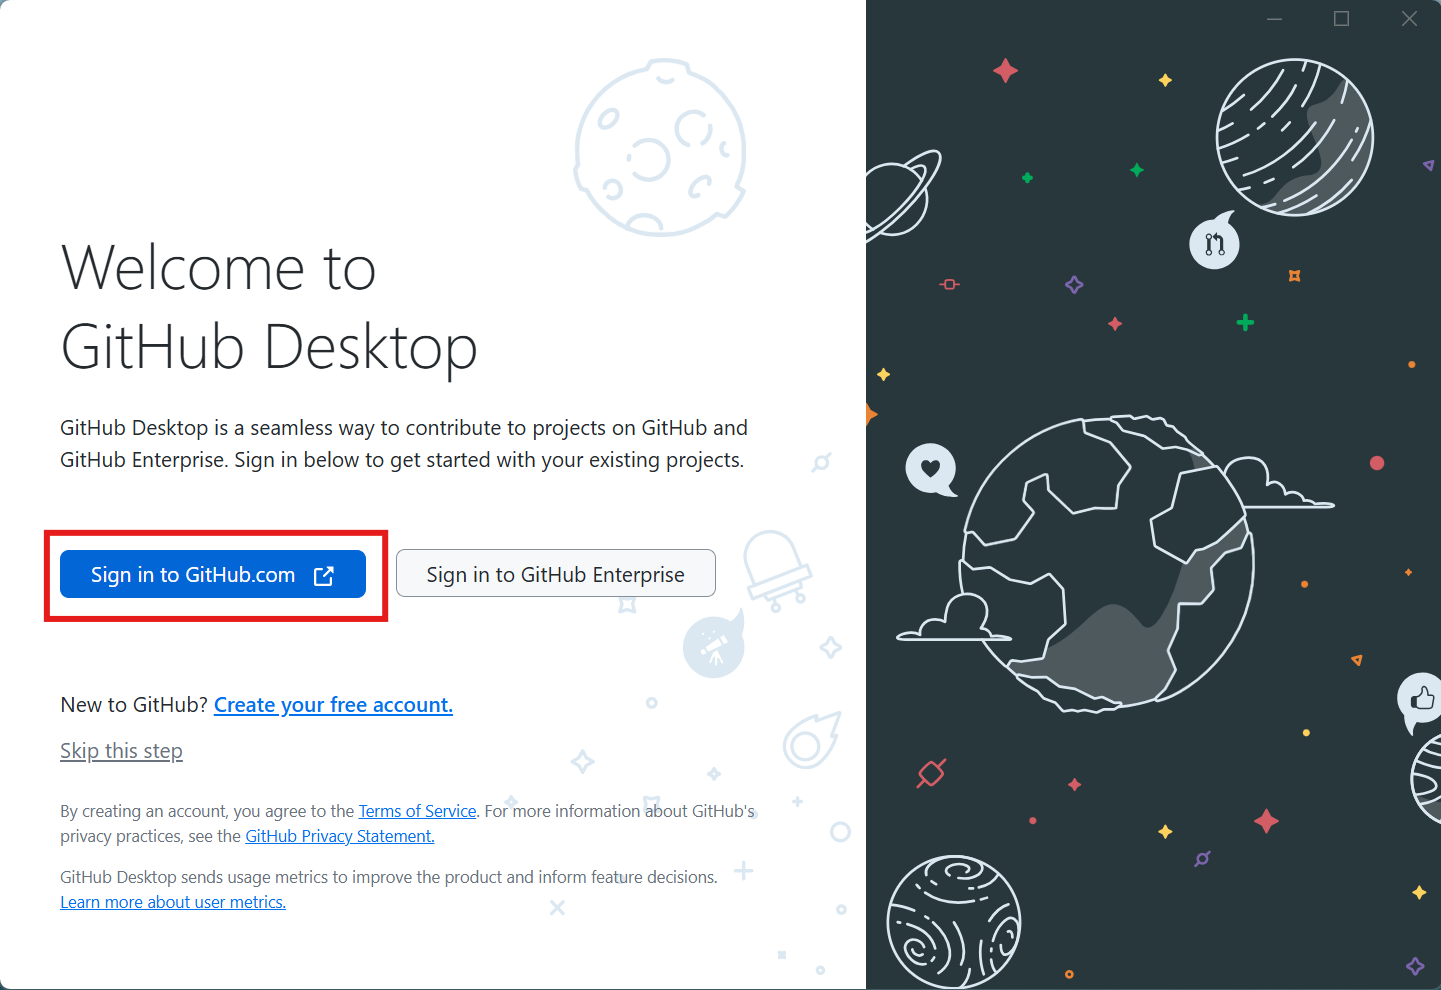
Next, authorize GitHub Desktop to access your GitHub account.
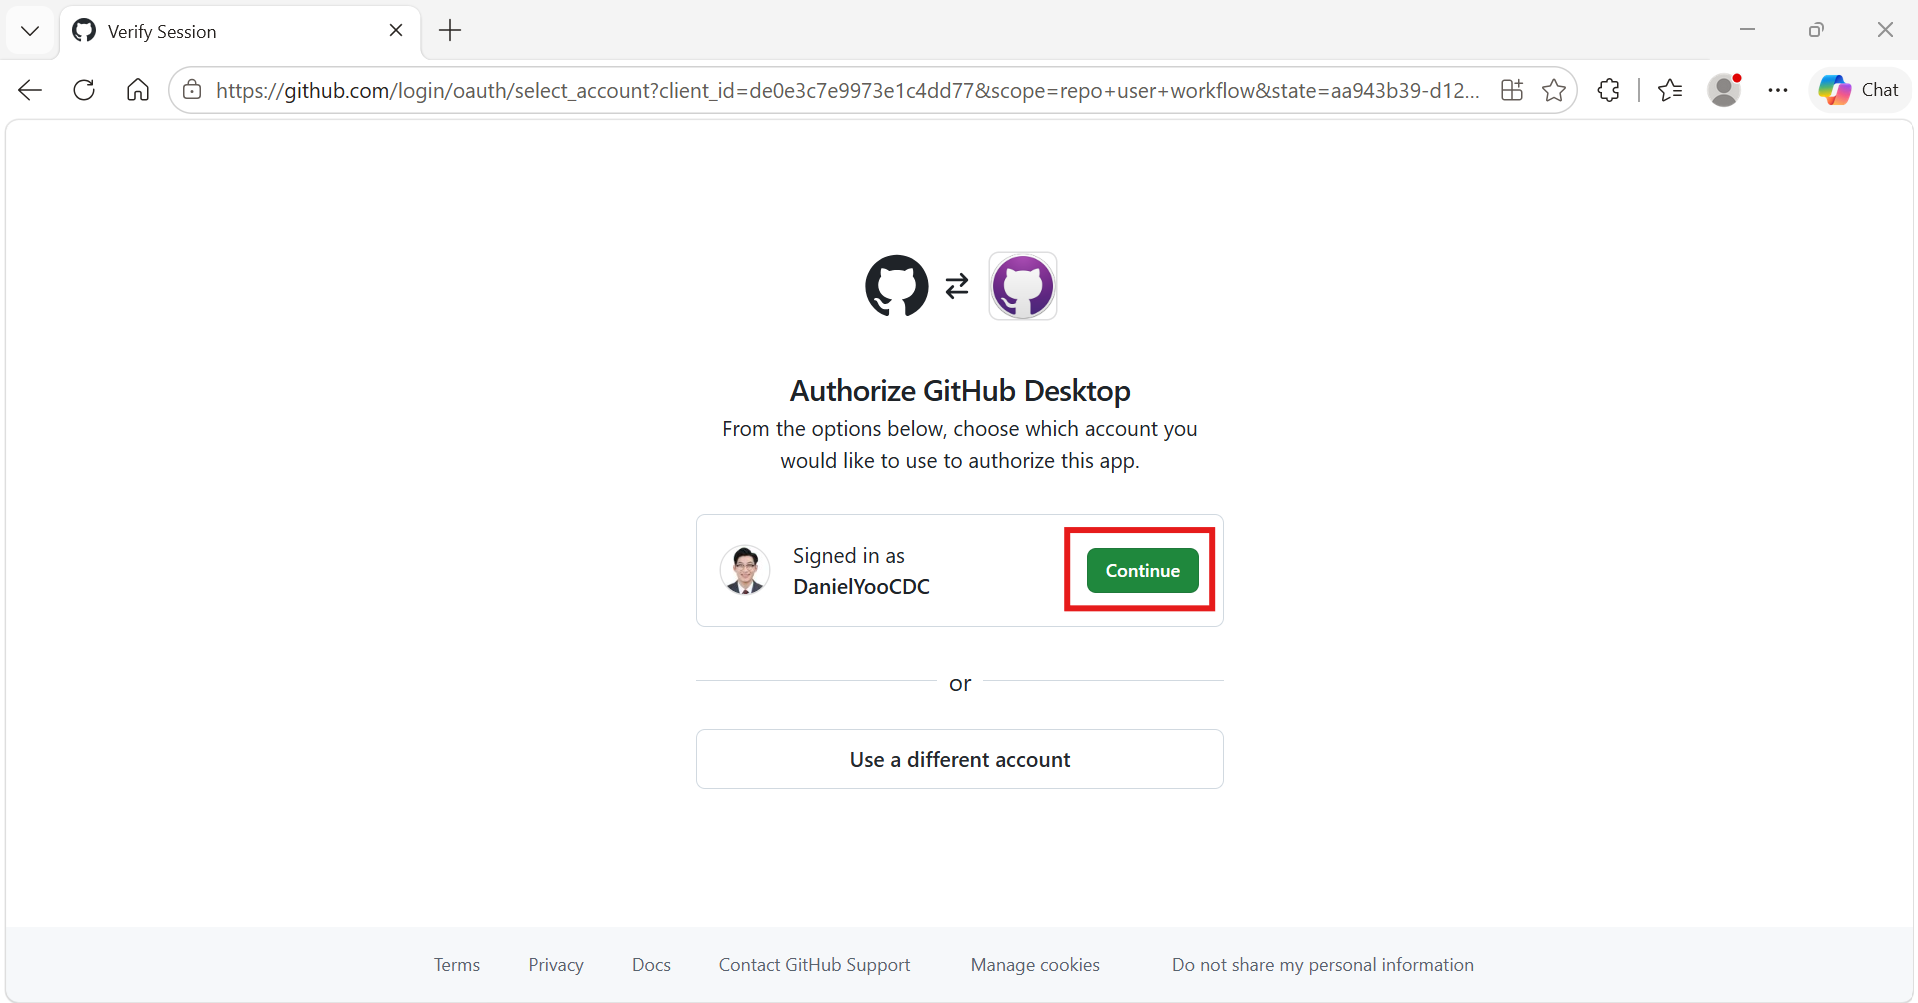
3. Download the hub setup files
Download hub-setup-files.zip from the Downloads page.
The ZIP contains the Hubverse time-series data, previous forecast output files, the Quarto weekly report, and the GitHub Actions workflow configuration.
After downloading, unzip the archive and keep the extracted files together in one folder. On Windows, right-click the ZIP file and choose Extract All; on macOS, double-click the ZIP file.
Create a hub within GitHub
1. Create a hub using a Hubverse template
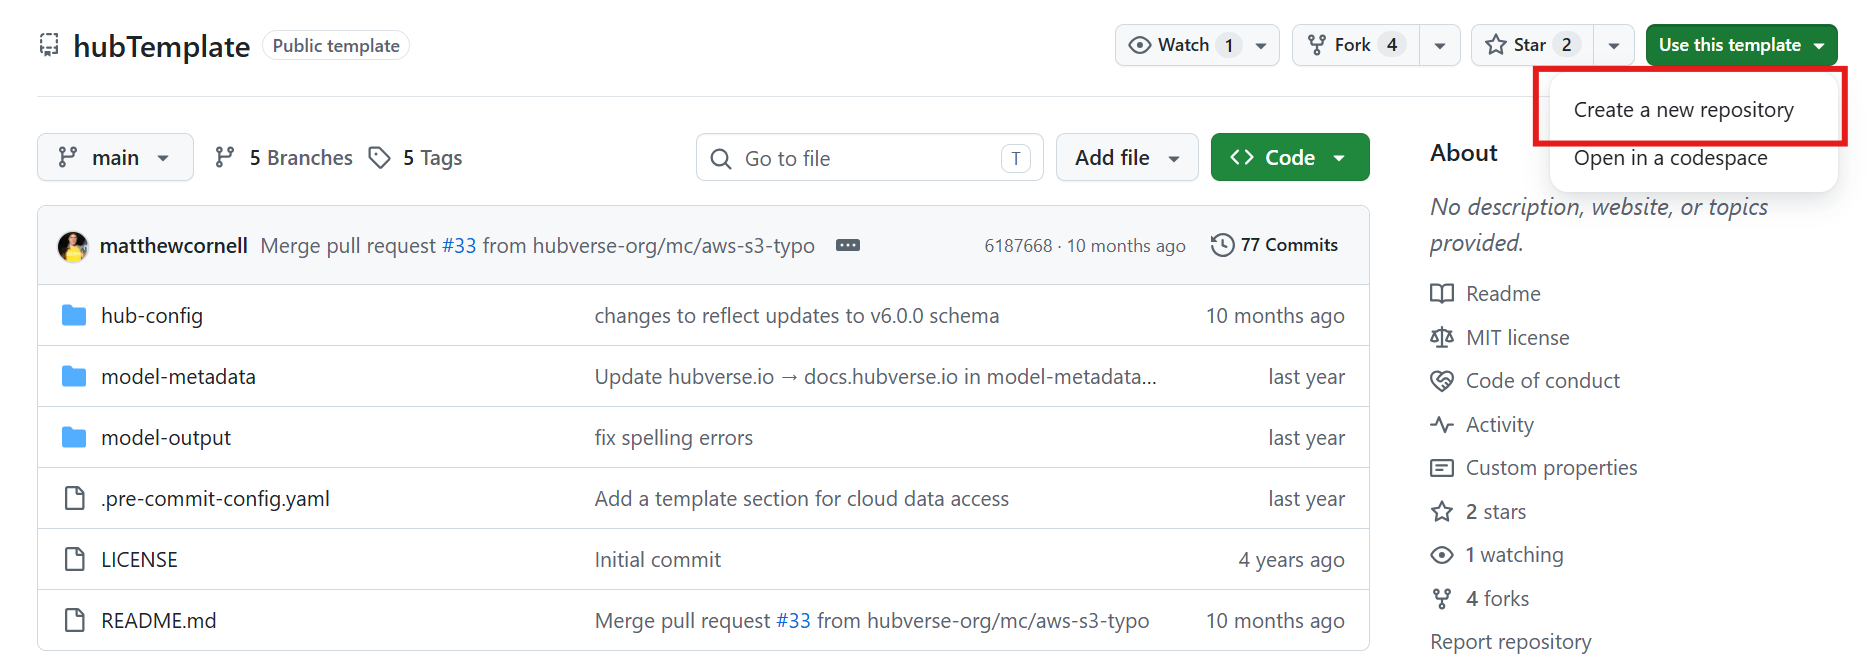
Use this link and click the Use this template button.
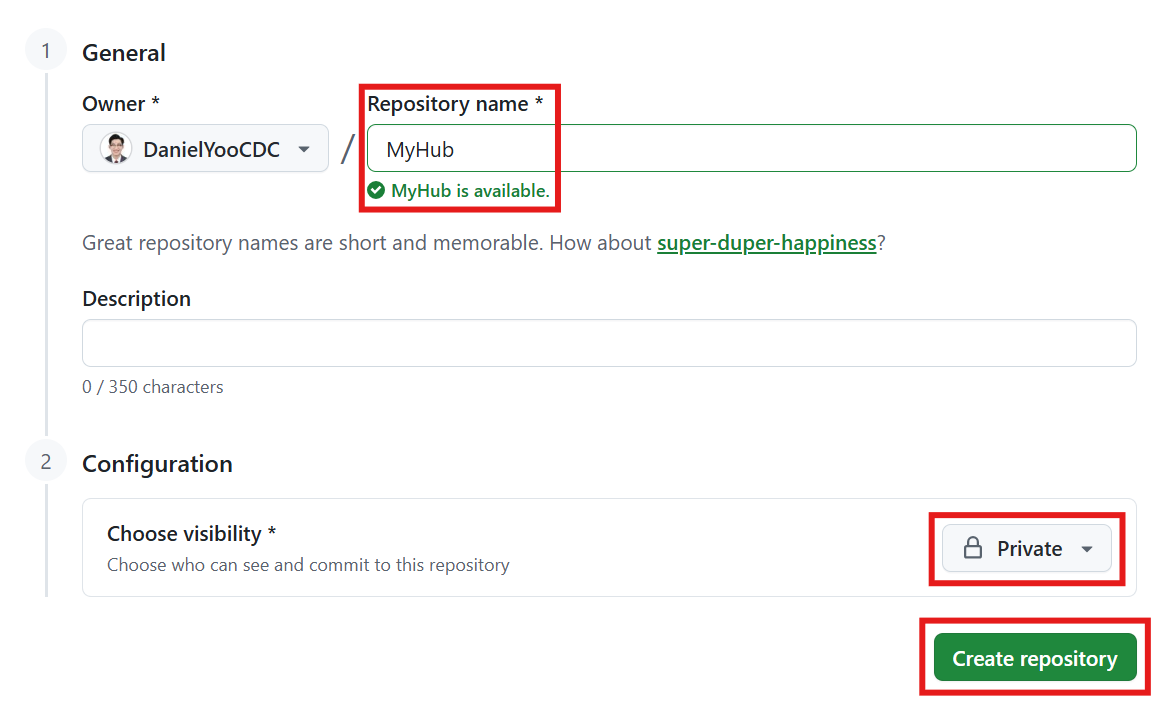
You’ll be taken to a page where you’ll enter a Repository name. This will be the name of your You’ll also see the option to make the repository public or private. If the data you’re forecasting is sensitive, choose private (we’ll use private for this workshop). Then click the Create repository.
2. Move remote hub to local machine
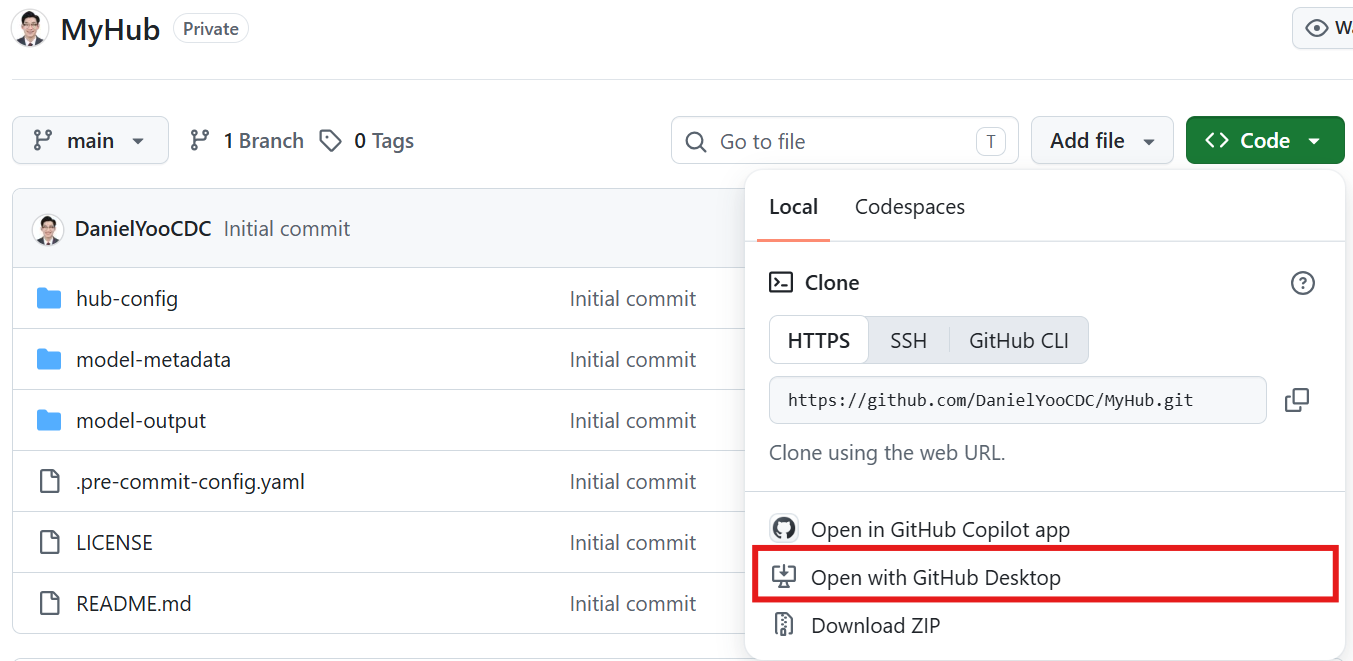
Right now, your hub exists remotely on GitHub. To work with it, you’ll connect it to your local machine by cloning it, which creates a local copy that stays linked to the remote version. You only need to do this once. Click the green Code button, then select Open with GitHub Desktop.
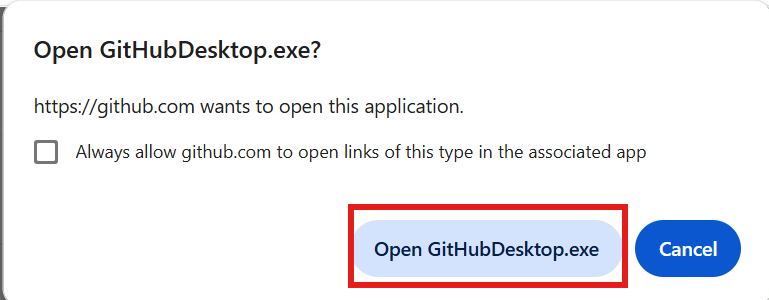
Your browser will ask whether you want to open GitHub Desktop. Click Open GitHubDesktop.exe
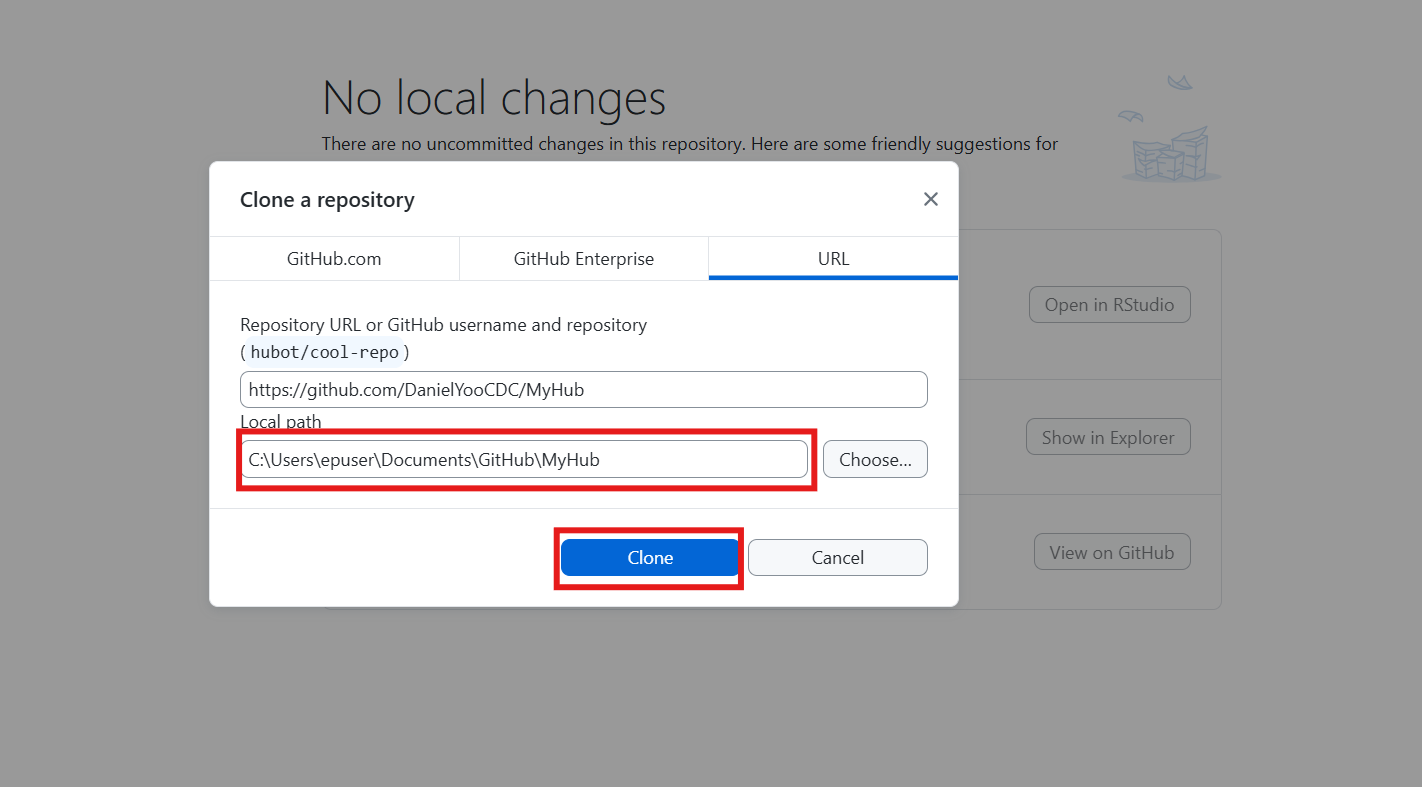
GitHub Desktop will launch and show a message. Under Local path, you’ll see where the hub will be saved on your machine. Then click Clone.
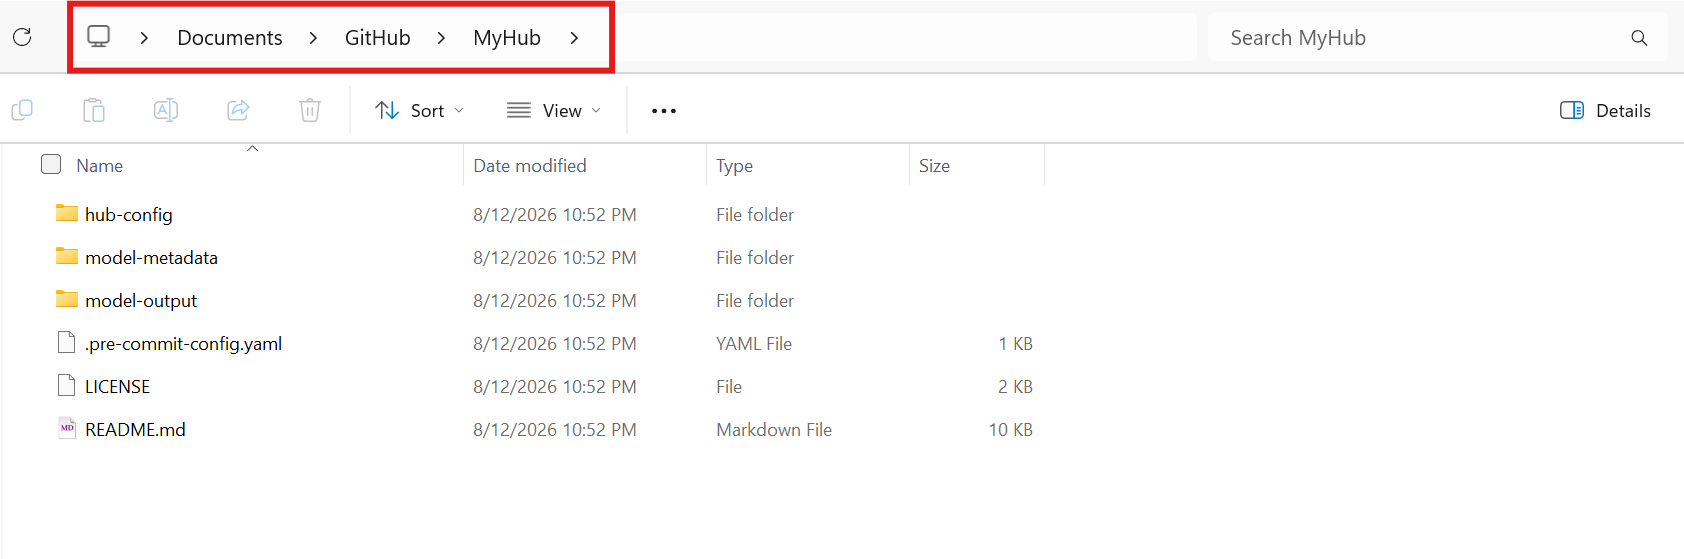
If you navigate to that file path, you’ll see the same folders and files that are in the remote hub, now on your local machine. If you have trouble finding where the hub was cloned to, go back to GitHub Desktop, click Repository in the top menu bar, and select Show in Explorer (Windows) or Show in Finder (Mac).
3. Initial folder setup
Next, set up the following folders.
Warning: Double-check that your folder names don’t have typos. All folder names should be lowercase.
Note: You’ll use the files you extracted from
hub-setup-files.zipin the Prerequisites section above.
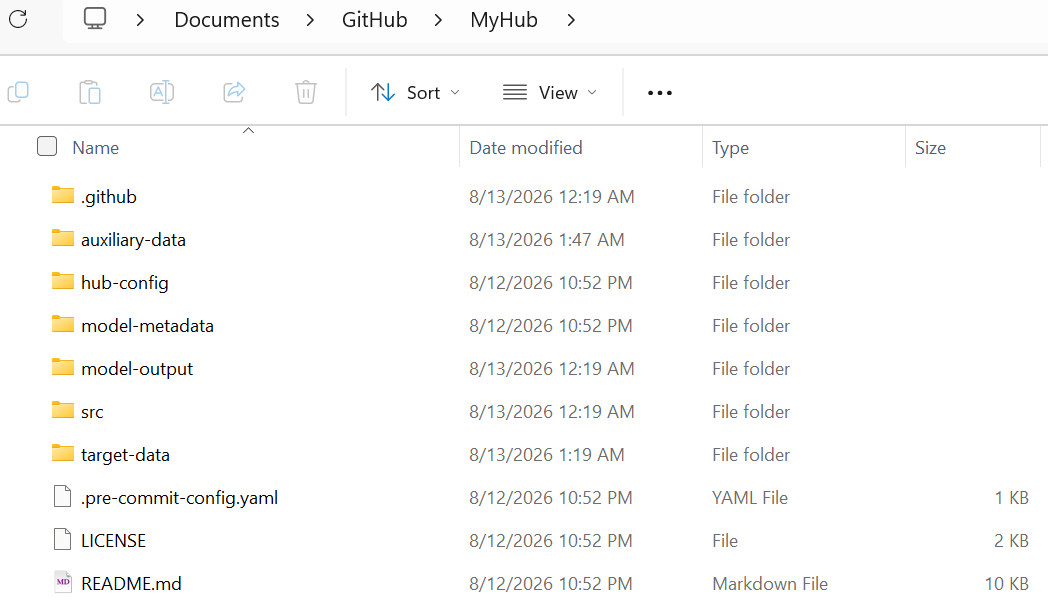
Create a src folder
This folder holds programming files, such as R scripts or
.qmd files, that you’ll run as part of the workflow. Move
the forecasting-weeklyreport.qmd file from
hub-setup-files.zip into the src folder.
Create a .github folder and workflows
subfolder inside .github folder
This folder holds the configuration file that tells GitHub which
files to run. Move the weeklyreport_run.yaml file from
hub-setup-files.zip into the workflows
folder.
Mac users: Finder may not let you create a folder
that starts with a period (.). If that happens:
- Open Terminal (press
Cmd + Spacebar, type “Terminal,” and press Enter). - Type
mkdir -p /path/to/your/hub/.github/workflowsand press Enter. For example:mkdir -p /Users/epuser/Documents/MyHub/.github/workflows. - The
.githubfolder may be hidden once it’s created. To unhide it: go to your cloned hub folder in Finder, right-click the.githubfolder, choose Get Info, and uncheck Hidden in the panel that opens.
Create a microhub folder inside
model-output
The model-output folder is where weekly forecast outputs
go. Since these forecasts come from the MicroHub tool, create a
microhub subfolder and place all MicroHub-generated
forecast files there.
For this exercise, assume forecasts have already been generated for
the past six weeks, as if you had been running and submitting them
weekly. Add the following files to the microhub folder:
microhub-output_2026-05-16.csvmicrohub-output_2026-05-23.csvmicrohub-output_2026-05-30.csvmicrohub-output_2026-06-06.csvmicrohub-output_2026-06-13.csvmicrohub-output_2026-06-20.csv
Sync local hub with remote hub
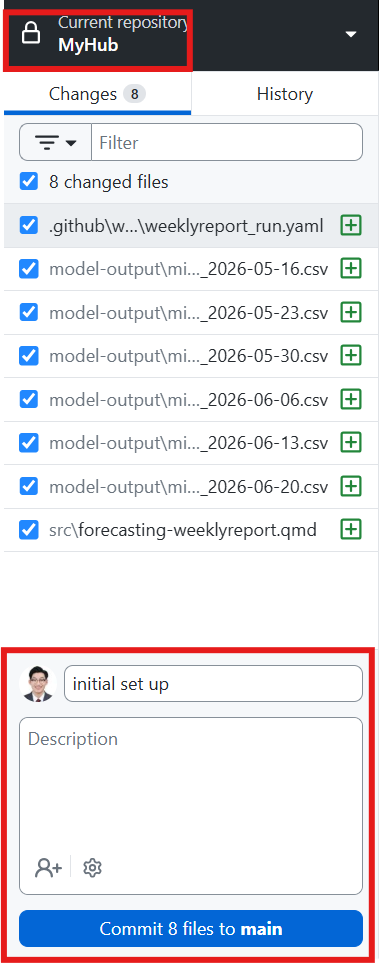
Now that the initial setup is complete, sync your local machine with the remote hub so both are up to date. We’ll use GitHub Desktop:
- Go back to GitHub Desktop and click Fetch at the top to refresh.
- Enter a commit message describing your changes — for example,
initial set up. - Click Commit to main. This saves all the changes you made, similar to saving a file.
- In the same spot where Fetch was, you’ll now see Push. Click it to push your local changes to the remote hub, so both are in sync.

Note: Unless you plan to extend this hub into a full collaborative hub or build a dashboard using the Hubverse ecosystem, you don’t need to touch the
hub-configormodel-metadatafolders. If you’re interested in these features, let us know and we can help you set them up.
Exercise: running through the weekly forecasting workflow
1. Getting the data ready for forecasting
Typically, data to be forecast is pulled at a set time each week.
Suppose we’re in week 26 of 2026 (June 21–27) and working with SARI data
from a country in Epidemic Zone E. The data has already been pulled from
the database and cleaned so it’s ready for the MicroHub tool — that’s
the microhub-target.csv file from
hub-setup-files.zip.
The other file is time-series.csv. It contains the same
kind of data as microhub-target.csv, but with the archived
history: each week’s microhub-target.csv gets appended to
it once uploaded. Suppose we’ve been archiving data since January 2026,
so time-series.csv already contains 26 weeks of appended
data.
Put both files — microhub-target.csv and
time-series.csv — inside the target-data
folder.
2. Run the forecast using MicroHub
Upload data
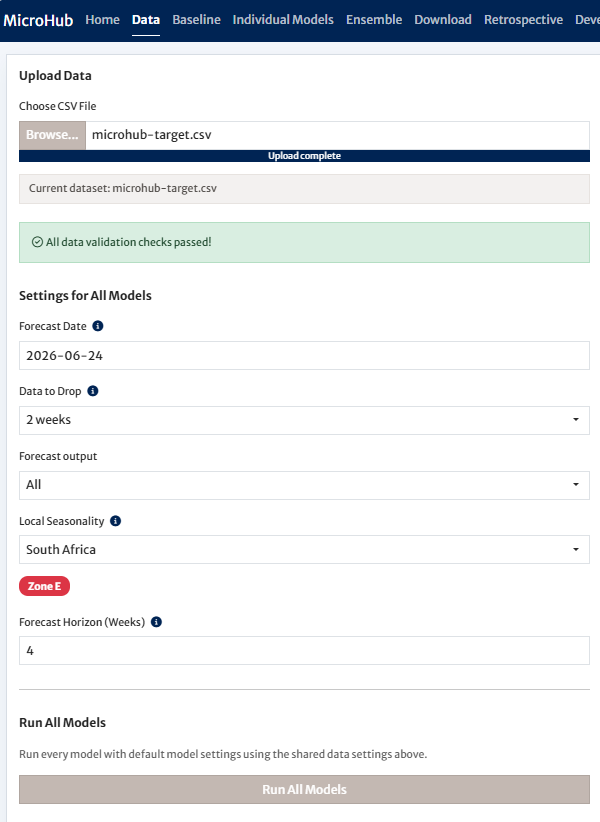
In MicroHub, choose microhub-target.csv from the
target-data folder in your hub. Let’s say we typically
forecast on Wednesdays. Wednesday of week 26 is 2026-06-24,
so select that date for Forecast Date. Looking at the
current year’s time series, it’s a good idea to exclude the two most
recent weeks from the model input, due to suspected data backfill. For
this exercise, choose any countries in Zone E, and leave the rest of the
settings at their defaults. Click Run All Models.
Run the ensemble
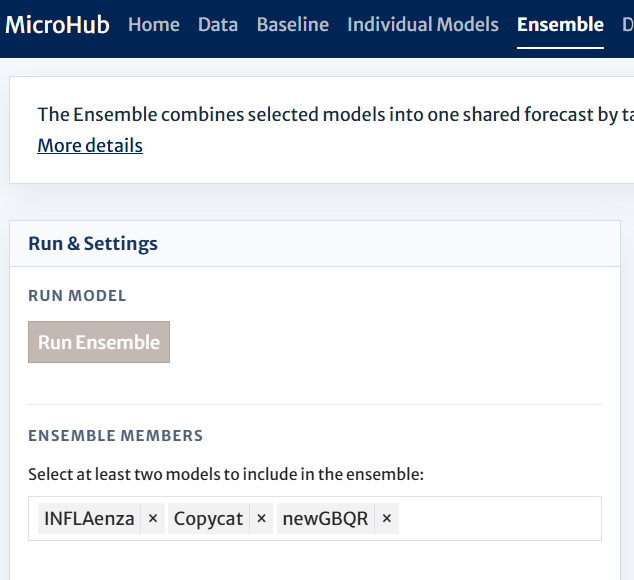
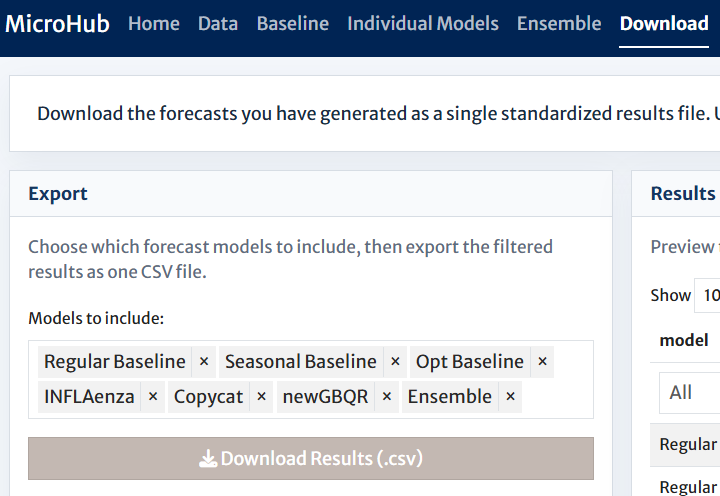
After all individual models have finished running, it’s time to run the ensemble model. Go to the Ensemble tab, select all three individual models (INFLAenza, Copycat, and newGBQR), and click Run Ensemble.
3. Weekly report generation
Run the GitHub Actions workflow
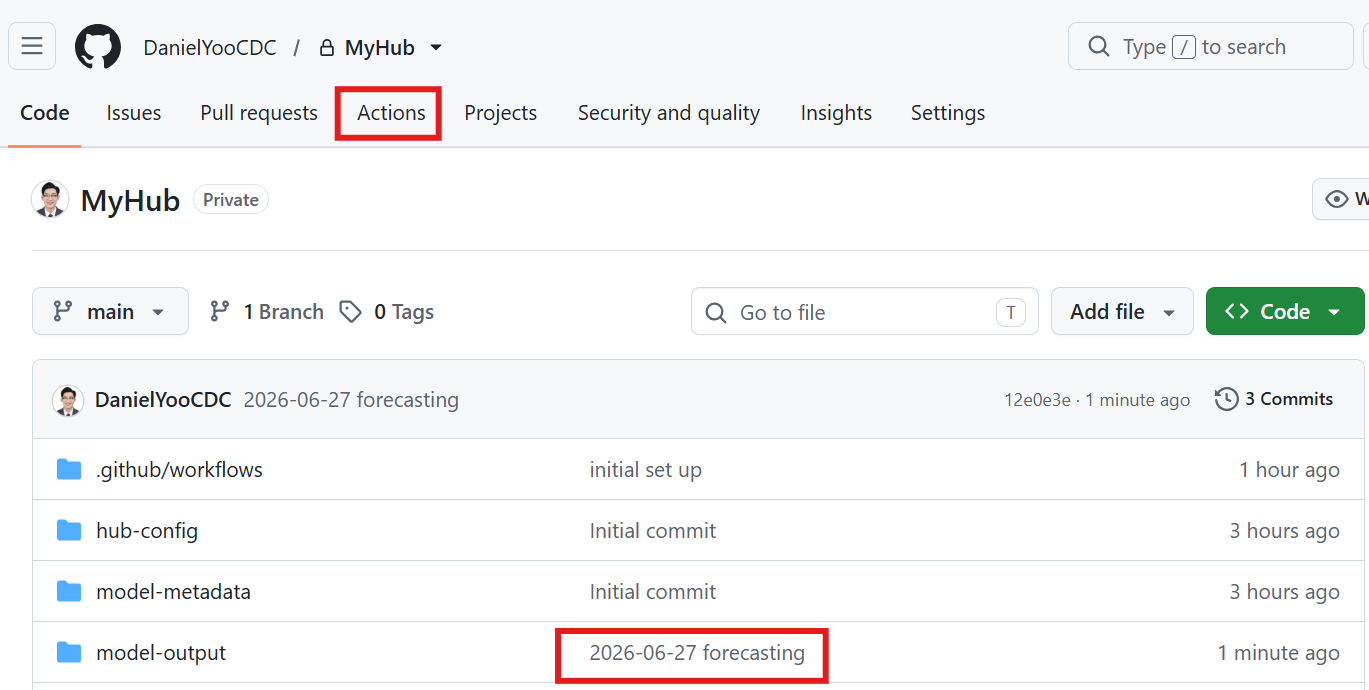
Go back to your remote hub on GitHub and confirm that the
2026-06-27 forecast submission is there. Then click the
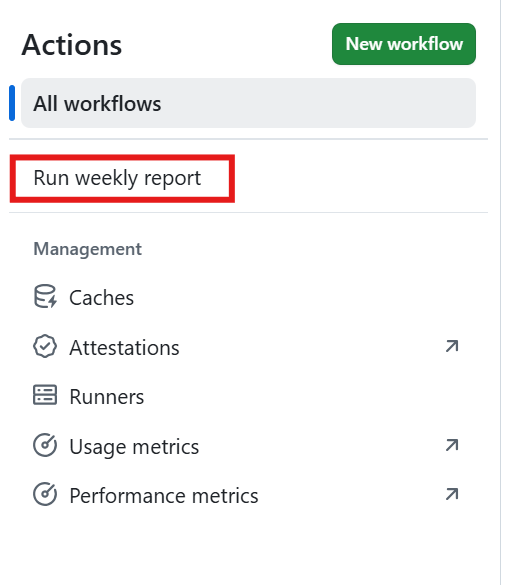
Actions tab. In the left panel, select the Run
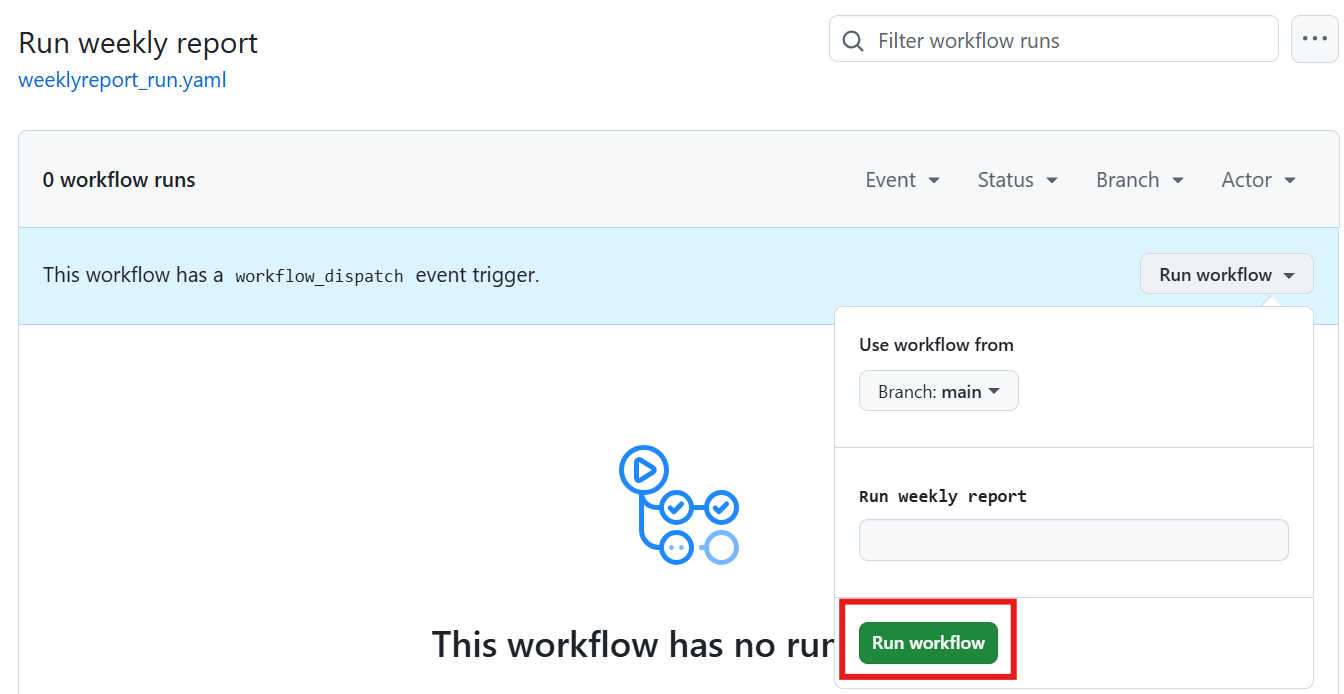
weekly report workflow, and click Run
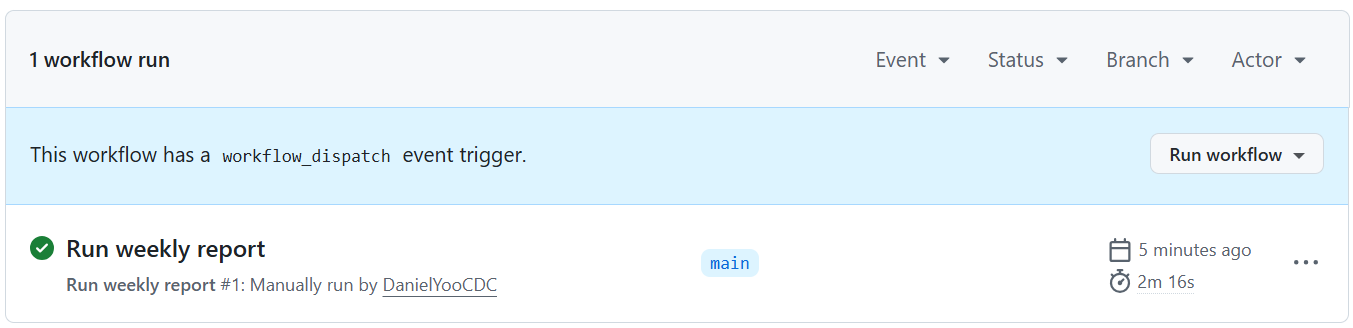
workflow. It will take a few minutes to complete. Once it’s
done, you’ll see a green checkmark.
Sync back to your local machine
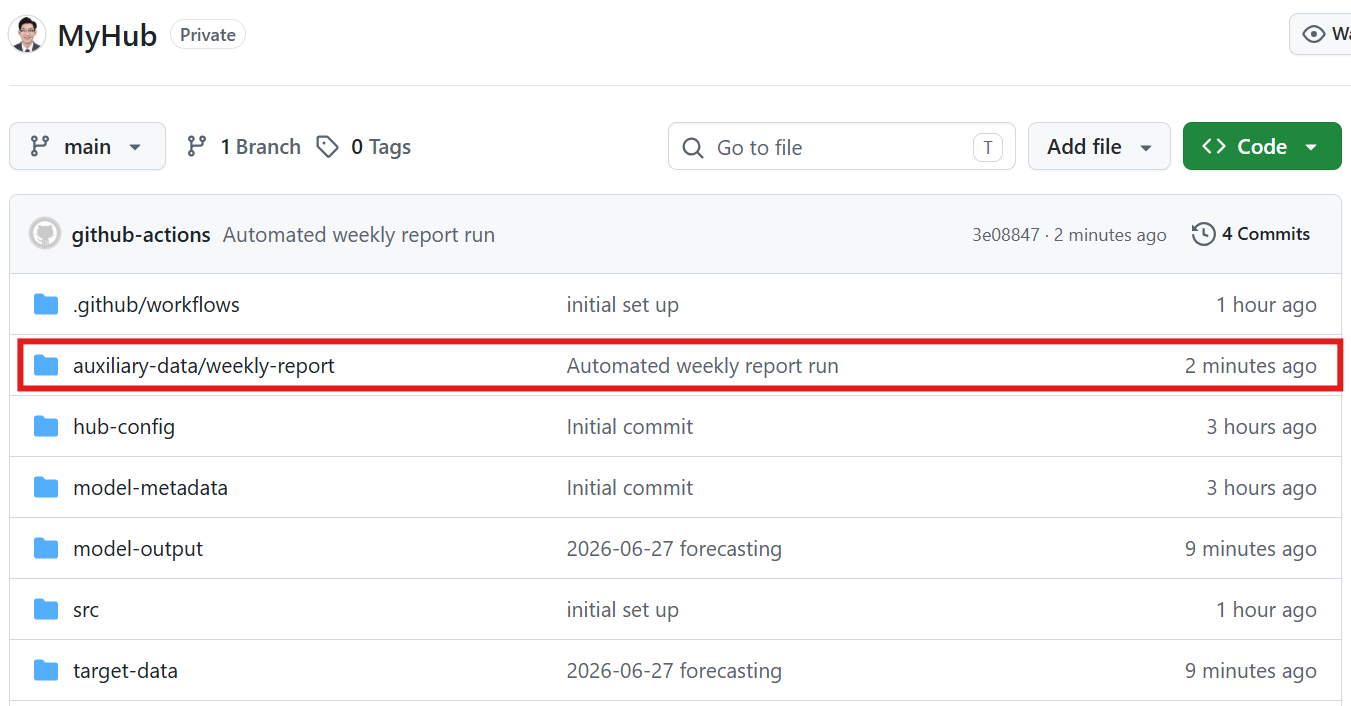
You can confirm the weekly report was generated by checking your remote hub. Since it was generated on GitHub, your remote hub has the new report, but your local machine doesn’t have it yet — so you’ll need to sync it back:
- Click Fetch to refresh.
- In the same spot where Fetch was, you’ll now see Pull origin. Click it to pull the remote hub’s changes to your local machine.
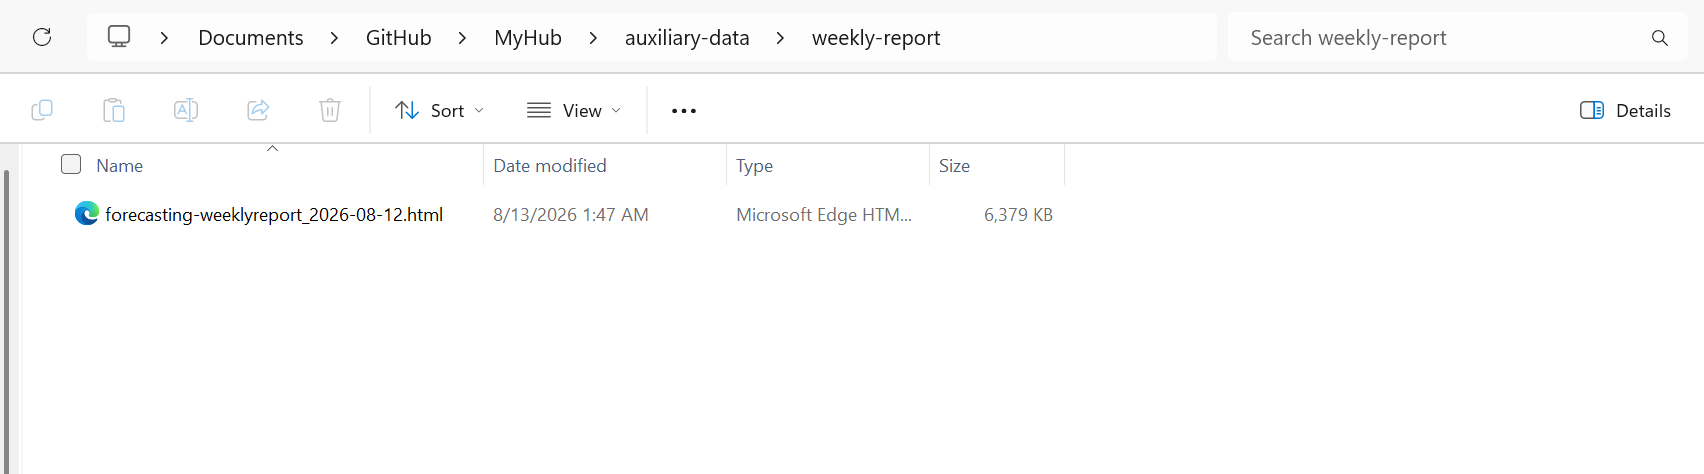
- Open the weekly report from your local hub folder.